FAIR Data Principles & Biodiversity Standards
Why and how to publish FAIR data
2026-07-21
What makes data FAIR?
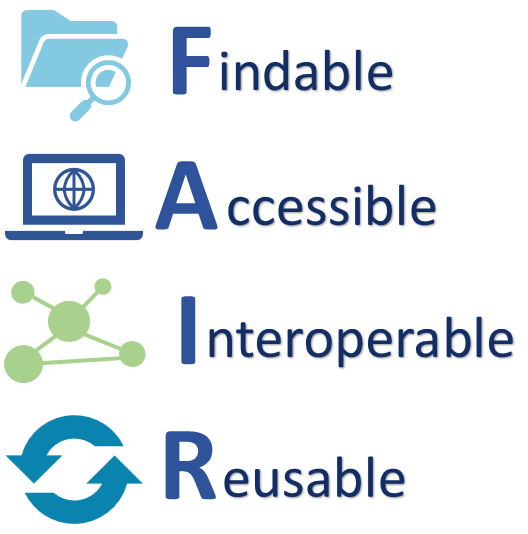
- Descriptive metadata with stable links (e.g. DOI)
- Clear instructions on how to access
- Not just “available upon request”
- Easily combined with other datasets & machine readable
- Metadata enables replication
- Data is contextualized
What can FAIR data do?
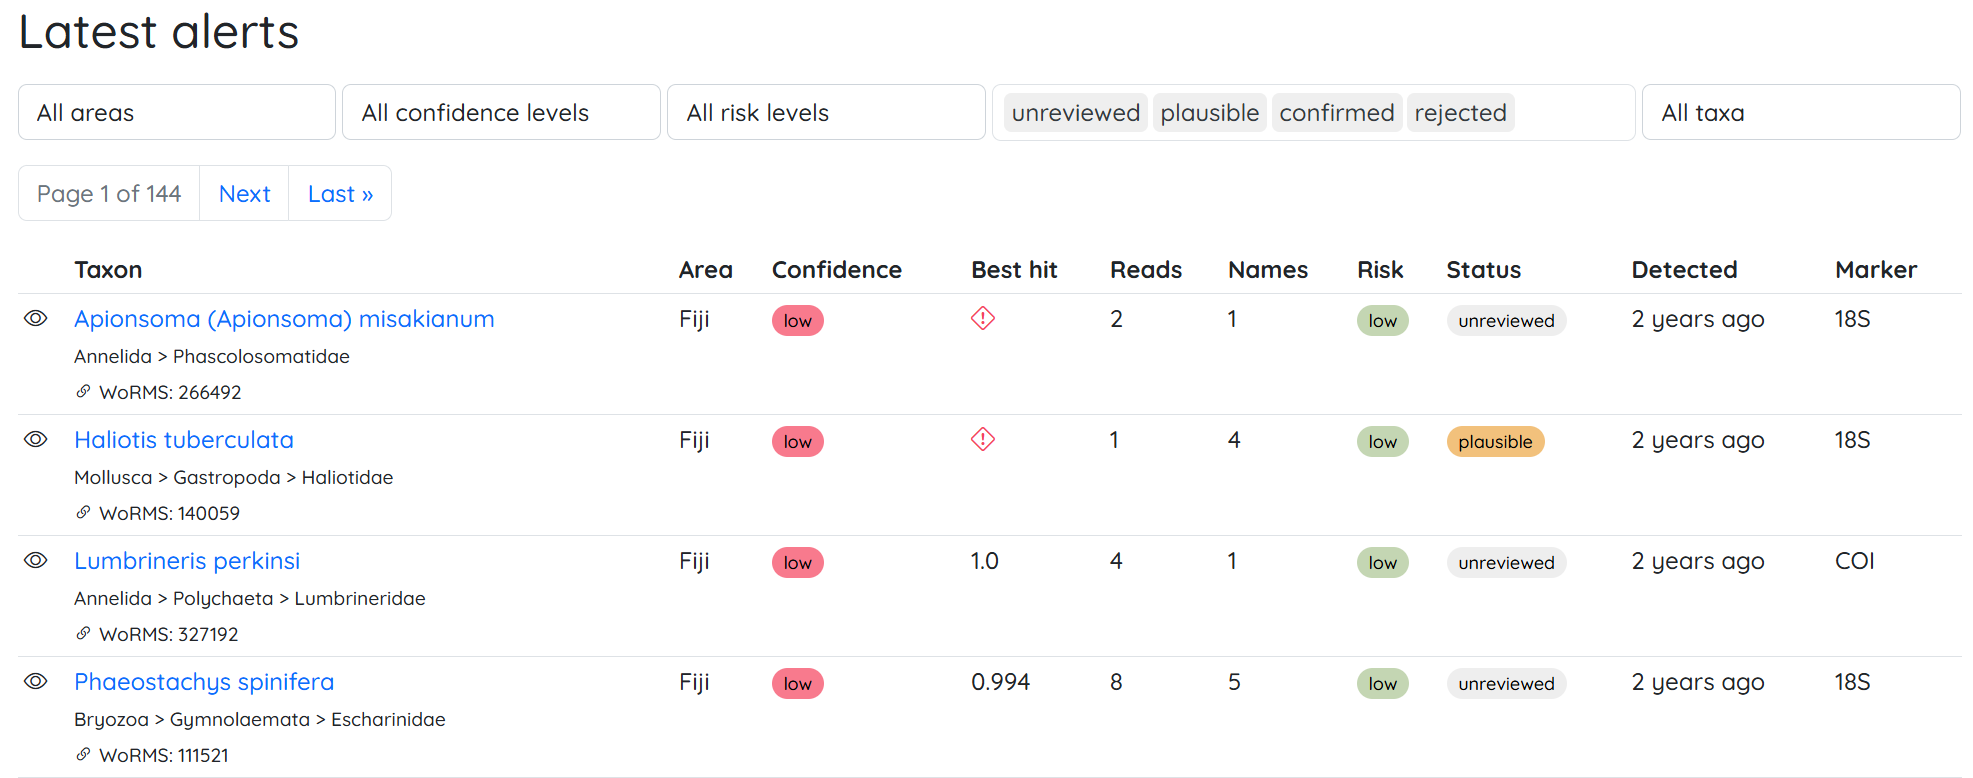
Invasive species decision tool & alert system portal.pacman.obis.org

How to manage and make data FAIR?


What is OBIS?
Ocean Biodiversity Information System
- Global open-access data system for marine life
- UNESCO Intergovernmental Oceanographic Commission
- > 199 M occurrence records from >7,000 datasets
- Data flows to GBIF — easy to publish once, reach both
Free to use. Free to contribute.

What is Darwin Core?
- Stable, shared vocabulary for biodiversity data
- Standardized field names, identifiers, & definitions
- Maintained by TDWG, used by OBIS, GBIF, and the wider biodiversity community
- Not a database itself - a set of agreed-upon terms (e.g.
scientificName,eventDate,decimalLatitude)
Think of it as everyone agreeing to call the same column the same thing - so your data and someone else’s can sit in the same table!
🤝
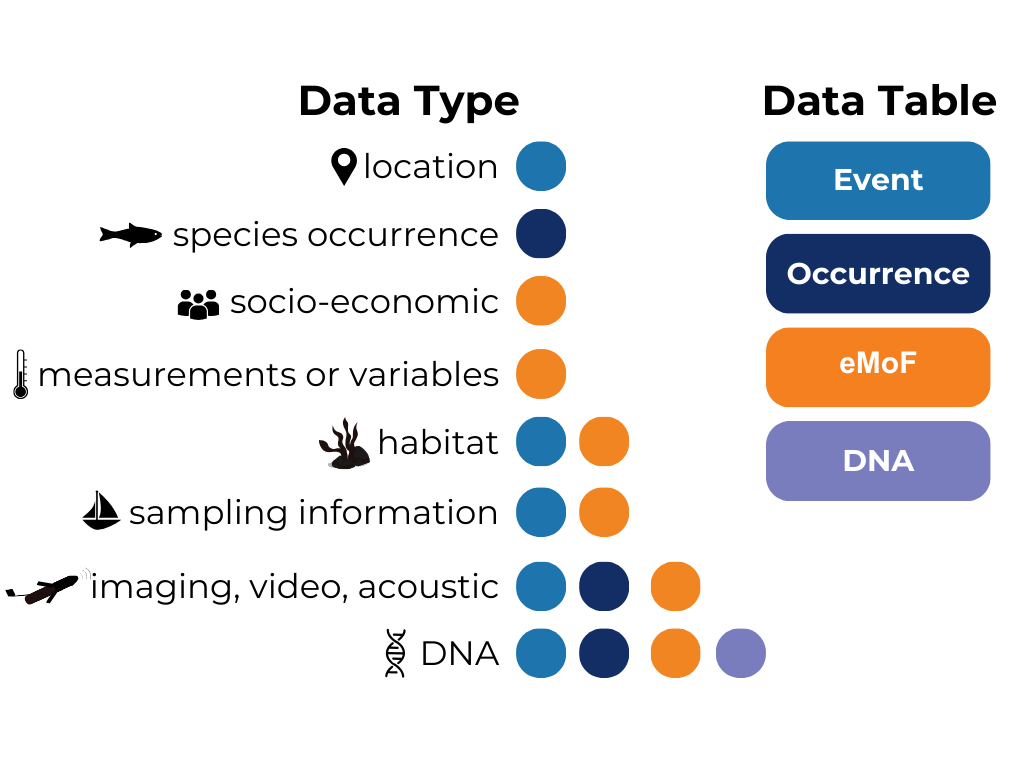
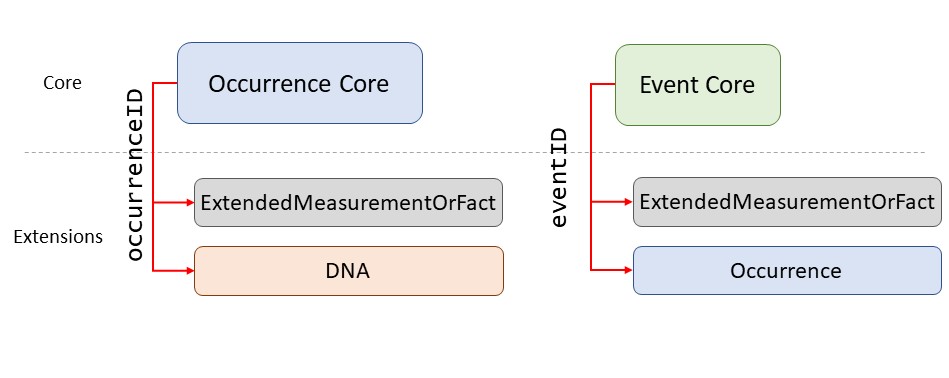
Core & Extension tables
- Every Darwin Core Archive has one core table: either Event or Occurrence
- Plus zero, one, or more extension tables (eMoF, DNA extension…)
- Extensions link back to the core via an ID
A note on sensitive data
Common cases:
- Endangered or commonly poached species locations
- Species/locations with economic sensitivity
Options → you don’t have to choose between “share everything” or “share nothing”:
- Generalize location - provide a region or polygon (
footprintWKT) instead of an exact point - Delay publication - prepare to publish but set an embargo for later
- Generalize taxonomic name - provide a higher taxon name
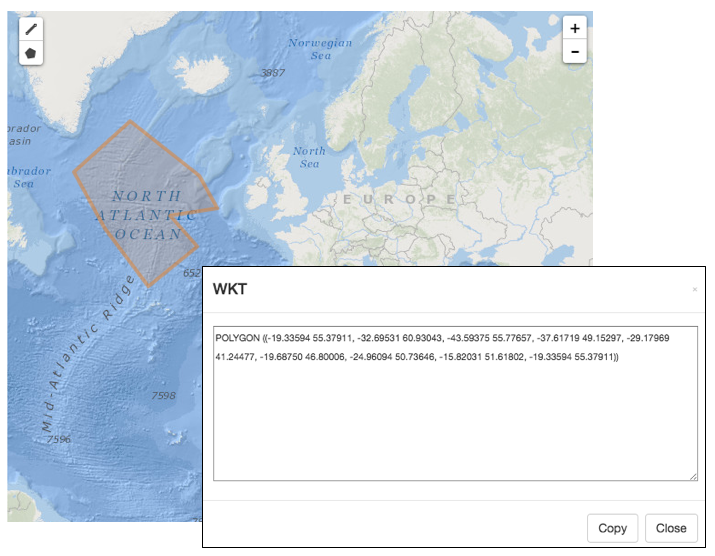
Note: Generalizations should be documented alongside your data! See OBIS Manual & GBIF Guide for more details
Essential Ocean Variables (EOVs)
- Defined by GOOS (Global Ocean Observing System, IOC-UNESCO)
- Minimum set of variables needed to track ocean state and change
- 36 EOVs → physical, biogeochemical, biological & ecosystem
- Specification sheets to guide data collection